Remodeling: Cost vs. Value
Gains in the new-home market are helping lift the value of remodeling projects even as costs rise.
From Remodeling magazine, January 2016
Bigger and more expensive projects, rising new-home prices, curb appeal, and energy efficiency all contributed to a slight gain in remodeling projects’ payback at resale, the 2016 Cost vs. Value report shows. The average cost and average return at resale for the 30 projects in this year’s report resulted in an average of 64.4% of a project’s investment dollars getting recouped if the home is sold within a year. That’s up from 62% in the 2015 report and the second-highest return in the past eight years. This year’s 64.4% deserves an asterisk because the 2016 report eliminates eight projects from last year, including some with the weakest returns , while adding two projects, one of which—attic insulation—topped the list. But if you look only at the 17 projects we’ve tracked since 2005, the results are similar.
For those 17, the average value recouped was 63.7%, up from 62.1% in the 2015 report and the second-best year in the past six. When you look at cost alone, regardless of whether you’re talking about the 17 perennials or all 28
projects that were in the 2015 and 2016 reports, the result was the same: The average project cost 4.7% more this year. But when you ask real estate professionals for their view of how much that project boosted a home’s value at resale within a year, the results varied according to which projects you included. For the 28 jobs tracked both years, Realtors estimated the average project’s dollar return was 6.7% higher in the latest report than in 2015. For just the 17 perennials, the gain in value was 7.3%.
Those differences give only a first sense of why Cost vs. Value isn’t so much a portrait of America’s remodeling industry as it is a kaleidoscope—one in which the view of our remodeling industry changes every time you turn the
data wheel. Because costs change independently from real estate pros’ assessment of value (and for our 17 perennial projects, they’ve moved in different directions six of the past 10 years), each year the resulting cost-value ratio will have a different reason for why it changed. This ratio expresses resale value as a percentage of construction cost: When cost is higher than value, the ratio is less than 100%; when value is higher than cost, the ratio exceeds 100%. It’s the “bang-for-the-buck” meter.
In last year’s report, the overall cost-value ratio went down from the previous year because valuations were cut on about half of the 36 projects. This time, the average return went up largely because real estate professionals were more optimistic, lowering their estimates of resale value on only five of the 30 projects surveyed. Of the 25 projects for which the real estate pros increased estimated paybacks, many of the biggest percentage gains were for higher-dollar “upscale” projects, a term we use to denote jobs that are more expansive and complicated than our baseline “midrange” projects. In fact, four of the top five gains in cost recouped were for upscale projects. Topping the list was the fiberglass entry door, up 21.2%. Then came the two-story addition, an 8.1% higher “recoupment” than in the 2015 report; the master suite, up 6.5%; and the major kitchen remodel, 4.2% higher.
BANG-FOR-THE BUCK METER
UPSCALE PROJECTS ADVANCE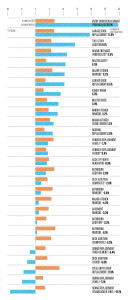
This ratio expresses resale value as a percentage of construction cost: When cost is higher than value, the ratio is less than 100%; when value is higher than cost, the ratio exceeds 100%. It’s the “bang-for-the-buck” meter. Topping the list was the fiberglass entry door, up 21.2%. Then came the two-story addition, an 8.1% higher “recoupment” than in the 2015 report; the master suite, up 6.5%; and the major kitchen remodel, 4.2% higher. Four of the top five percentage gains in cost recouped were for upscale projects— jobs that are more expensive and complicated than our more common midrange projects. Costs went up for all 28 projects that were in both the 2015 and 2016 reports, but real estate pros lowered the value at resale for five of them.
Why did real estate professionals raise their estimates more often on the most recent survey than the year before? Odds are it’s because their views on the value of remodeling often are tied to the state of the local real estate market. And for most major U.S. markets, that state has been good. Through last October, prices for existing homes were up 5.9% from the year earlier, and that’s on top of a 5.7% gain for all 2014, the National Association of Realtors reports.
Meanwhile, the annual rate for new-home starts through November was tracking more than 15% above its November 2014 pace. Prices have been doing well too, with the Case-Shiller Index of prices for 20 major markets up 4.7% in August from the same month in 2014. “We’ve seen a steady ramping up on both the sales and construction side,” said Jonathan Diehart, director of custom services and published research at Metrostudy, the data unit that’s a sister company to Remodeling. “I think over time that really starts to loosen up prices a bit and allows some of these [remodeling] factors to become more significant as part of the price. When times become more difficult, the price becomes competitive. When times are better, the price bands get bigger [on homes of equal size]. It’s no longer ‘It’s a 2,500-square-foot house so it should cost this,’ but rather ‘It’s a 2,500-square foot house that has this and this.’” Those trends matter, because Metrostudy also cites NAHB research that found roughly 60% of homeowners launch a remodeling project within six months of moving in.
INSULATION TOPS THE LIST
The average 64.2% cost-recouped percentage for all 30 projects in all 100 markets hides vast variations between projects and between markets. This year’s highest return came from one of two newcomers to the report—an attic insulation project. As insulation jobs go, this task is fairly simple: Blow loose-fill fiberglass insulation into a 35×30 attic space until you get an R-30 insulation value. Our cost consultant concluded that such a project would cost an average of $1,268 nationwide. Real estate pros, meanwhile, estimated the project would increase a home’s retail value by an average of $1,482. That’s a $116.90 return for every $100 invested, making attic insulation the only project out of the 30 that averaged out nationally with greater than a 100% return. On a market-by-market basis, installing insulation more than paid for itself in 60 of the 100 markets (click below for more details).
INSULATION: A 116.9% RETURN
NEW THIS YEAR: FIBERGLASS ATTIC INSULATION 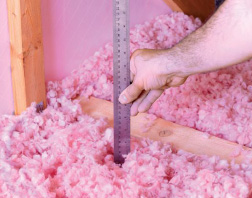
We’ve been asked for years to add an energy efficiency project to Cost vs. Value, but we’ve hesitated to do so because such projects often measure their payback in years, while the value part of Cost vs. Value is meant to reflect resale value within 12 months of the project. The influence that geography plays in energy projects also daunted us, as did the fact that lots of utilities and governmental entities have incentive programs that can artificially reduce installation costs. But ultimately we decided to take the leap, and boy are we glad we did.
The fiberglass attic insulation project produced the top return on cost of any of the 30 projects in this year’s Cost vs. Value group. Our cost source, RemodelMAX, estimated the project would cost an average of $1,268 nationwide. Real estate professionals responding to our survey estimated that work would increase the price of a home at resale, within a year of the project’s completion, by $1,482. That’s a 116.9% return.
The project calls for a pro remodeler to air-seal a 35×30 attic floor to address any air leakage from conditioned space to unconditioned space. Then the pro would add fiberglass loosefill insulation, placing it on top of existing insulation if present. Fiberglass loosefill would be applied until thickness equating with R-30 insulation value is reached. The North American Insulation Manufacturers Association helped come up with that language.
Sticklers might note that R-30 falls short of modern energy codes in much of the United States and simultaneously goes beyond the code in other regions, so the amount of loosefill insulation that you’d recommend installing will vary. But one vital part of Cost vs. Value is that we seek to give costs for the same project from coast to coast; that enables us to spot local differences. We stuck to that model.
Last year’s No. 2 bang-for-the-buck project, manufactured stone veneer, again came in second with a 92.9% return. It was followed by the midscale garage door replacement at 91.5%, a steel entry door replacement (last year’s No. 1) at 91.1%, and the upscale garage door replacement at 90.1% In contrast, the five projects with the worst returns all scored cost-value ratios between 56.2% and 57.7%. From the bottom up, they are: midrange bathroom addition, upscale bathroom addition, upscale master suite, upscale bathroom remodel, and composite deck addition. Thirty projects times 100 markets yields 3,000 cost-value ratios. Of those, 296 equaled or topped 100%. On the other hand, 439 projects from across the nation didn’t even reach 50%. As a general rule, the simpler and lower-cost the project, the bigger its cost-value ratio. Four of the five projects that cost less than $5,000 for a pro to do were ranked in the top five for cost recouped, and the remaining one was the cheapest project in the $5,000-to-$25,000 price range. No project costing more than $25,000 ranked better than 15th.
This is in part because the simpler projects tend to require less time and skill by a professional remodeler. It stands to reason that it’s far easier to replace a steel entry door than it is to design, source, and build a two-story addition. Note as well that 12 of the 15 highest-scoring projects were for work done on the exterior of the home. This showing jibes with academic research and real estate professionals’ comments touting the value of projects that promote “curb appeal” (future article will focus solely on that area).
NEW THIS YEAR: ENGINEERED SIDING
Introductions of several brands of siding that aren’t made from vinyl, fiber cement, or solid-sawn wood led us to include a new project this year, involving what we decided to call “engineered siding.” Examples include LP’s SmartSide and Boral’s TruExterior. We kept the project description the same as for the vinyl and fiber-cement projects: Replace 1,250 square feet of existing siding, then include factory trim at openings and corners. 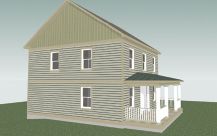 Our consultants figured it would cost an average of $13,832 nationally to buy and install an engineered siding product; real estate professionals concluded that doing so would increase value at resale by $10,866. That produces a cost-recouped ratio of 78.6%. Fiber-cement came in at 78.1%, but the two numbers are well within the margin of error.
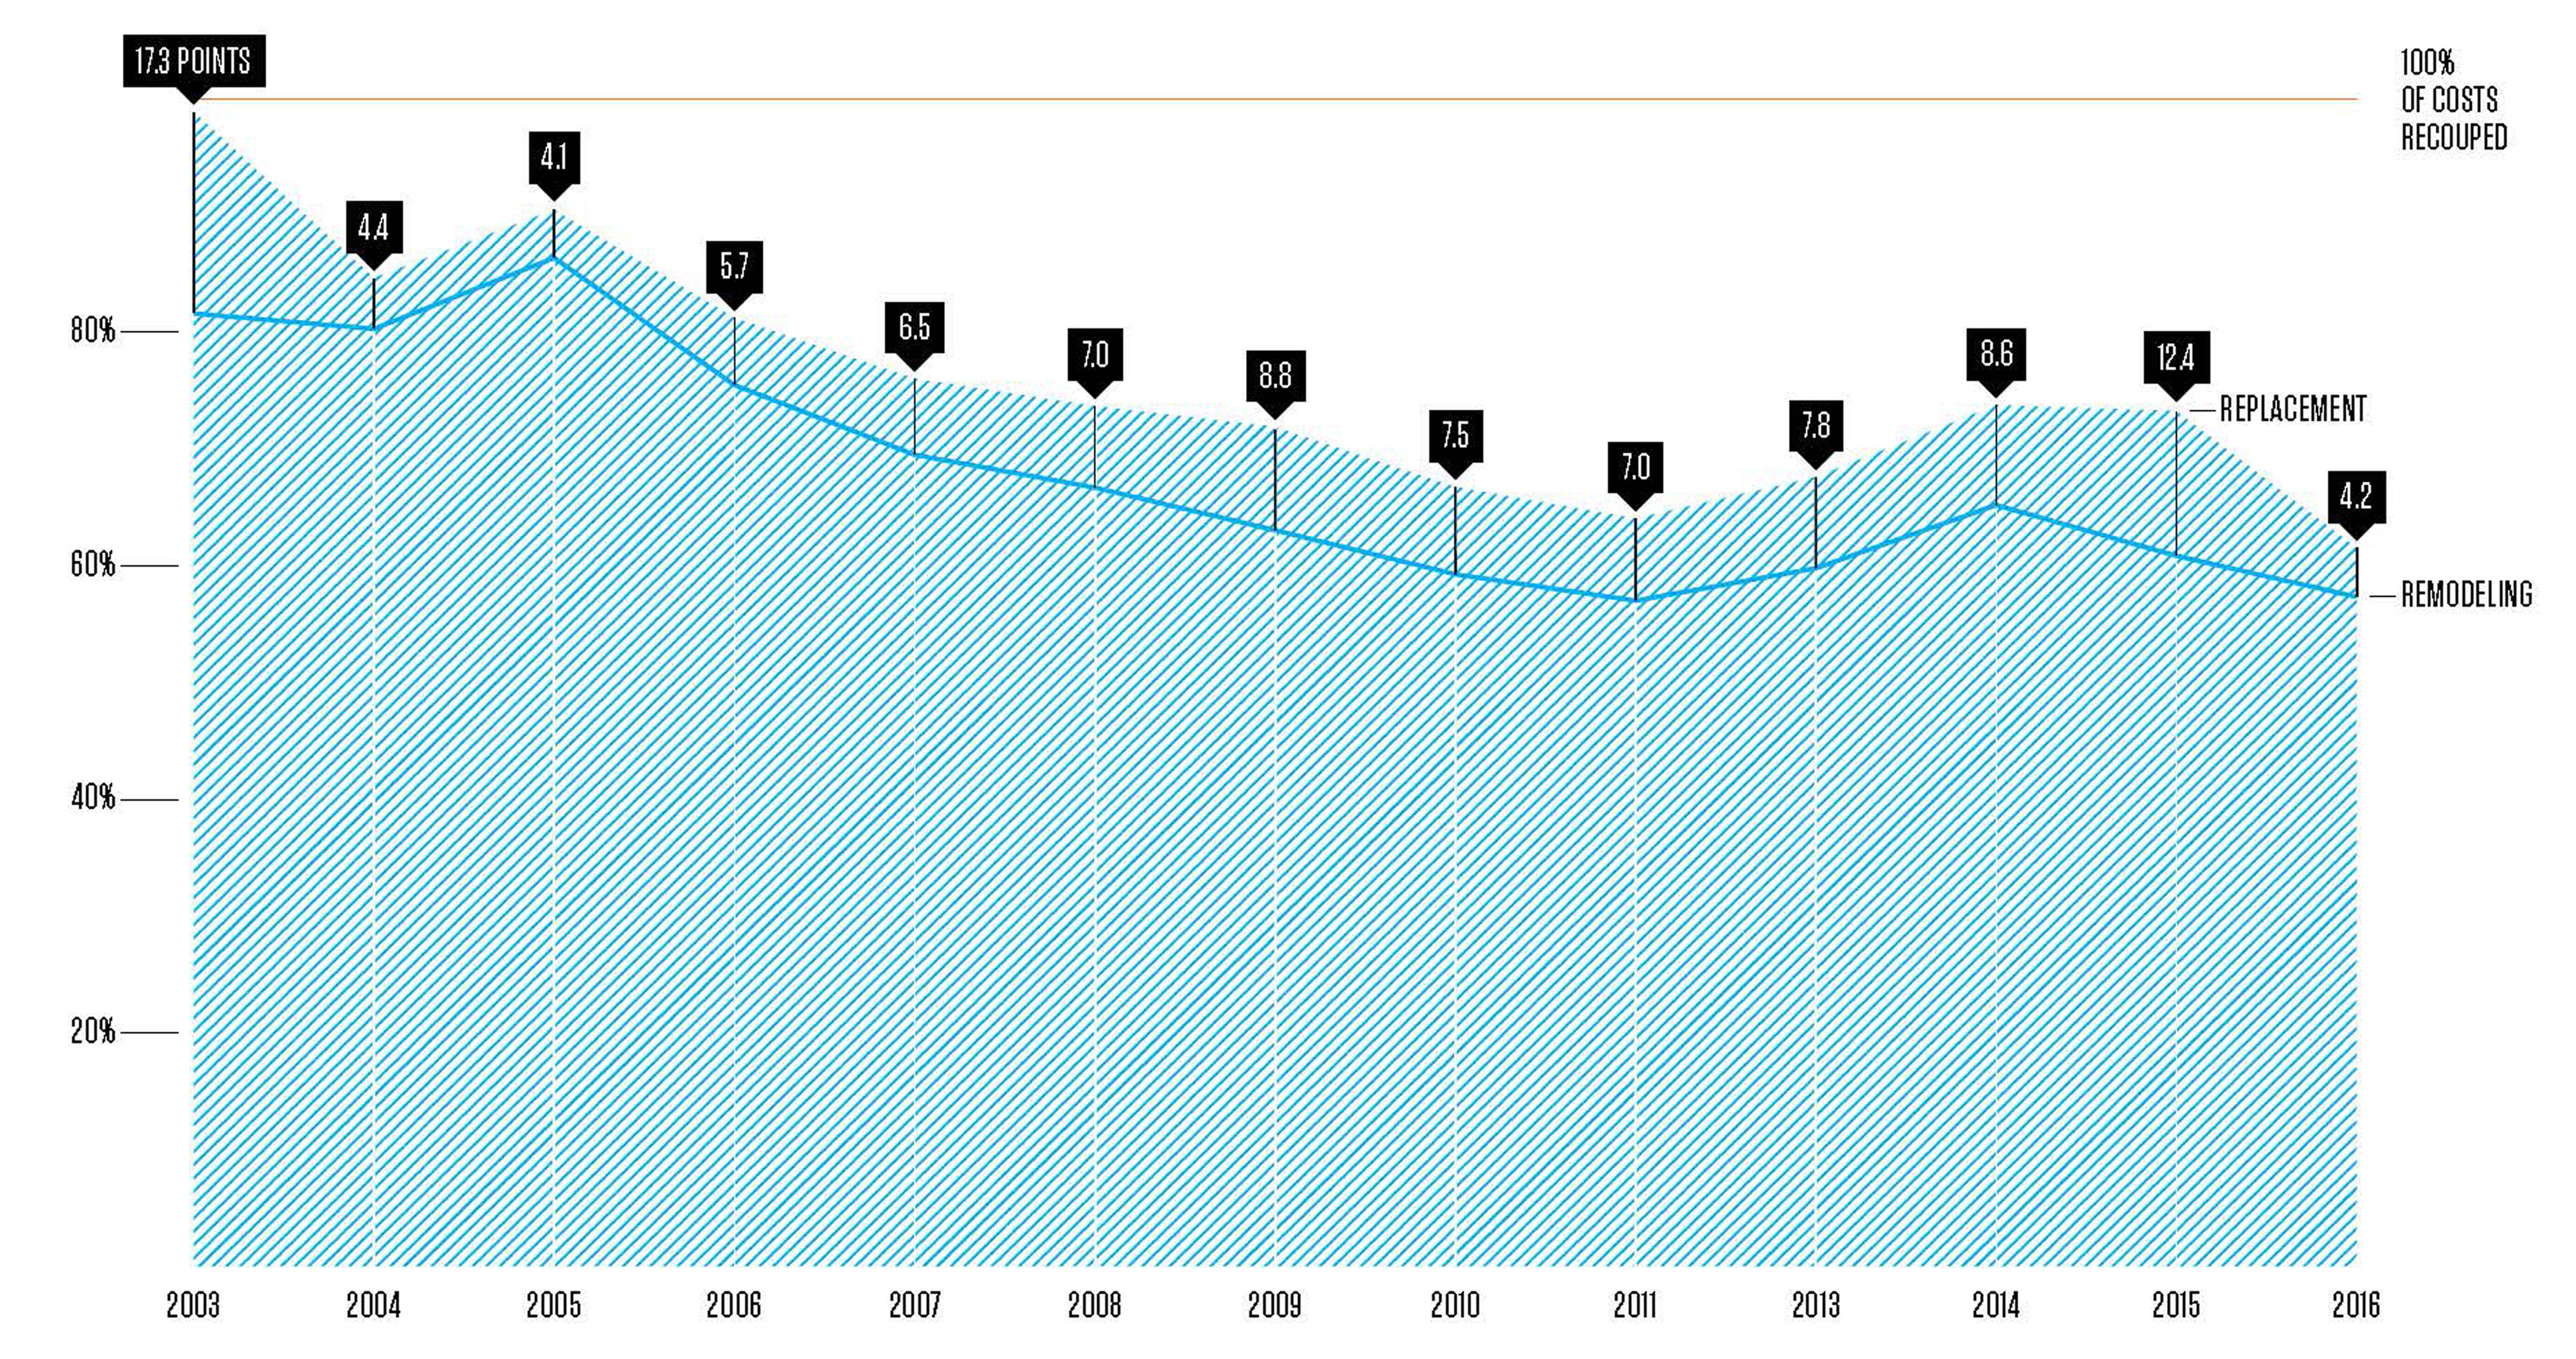
REPLACEMENT VS. REMODELING
Replacement jobs—such as door, window, and siding projects—generated a higher return than remodeling projects. That’s been the case since at least 2003 (see tab below, NARROWING THE GAP: COST RECOVERY). But in this latest report, the gap between the average replacement and the average remodeling job shrank by about two-thirds, to just 4.2 percentage points. Replacement projects averaged a return of 61.5% while remodeling projects scored 57.3%. This gap typically wanes when housing gets hot and waxes when the economy cools and there’s less upside for projects at resale. The narrowing in the 2016 report may be one more byproduct of the belief that bigger projects are getting viewed more favorably by Realtors.
NARROWING THE GAP: COST RECOVERY
TRENDING ON THE RISE
Only once in eight years has there been an overall average cost-value ratio higher than the 64.2% in this year’s report. And even if you account for additions and deletions of projects, this is still the one of the best years of the past six.
When grouped by job type, window and siding jobs fared better than kitchen and bath work, again perhaps because of curb appeal. Window and door jobs had percentage returns ranging from the upper 60s to upper 70s, while most kitchen and bath jobs were in the 50s and 60s. But across the board, all these jobs saw slippage in their cost-value ratios; the only one that rose was minor kitchen remodels, whose payback climbed to 83.1% in the 2016 report from
79.3% the previous year.
GEOGRAPHY IS DESTINY
Cost vs. Value data is developed for and collected from 100 metropolitan statistical markets. Some are modestly sized, such as Chapel Hill, N.C. Others are enormous: Los Angeles encompasses all of L.A. and Orange counties, while the New York metro area takes in all of Long Island and half of New Jersey plus parts of Pennsylvania.
For all the differences you can find within a market, the differences between the markets are just as enormous. For instance, in San Francisco, the entire suite of 30 projects averages greater than a 100% return. That’s the only place
in the country that can claim such a status, but Winter Haven, Fla., comes close at 99.3%. San Francisco and Honolulu have been longtime leaders in this category. The shortage of housing in both markets appears to be the major reason why.
LOCATION MATTERS
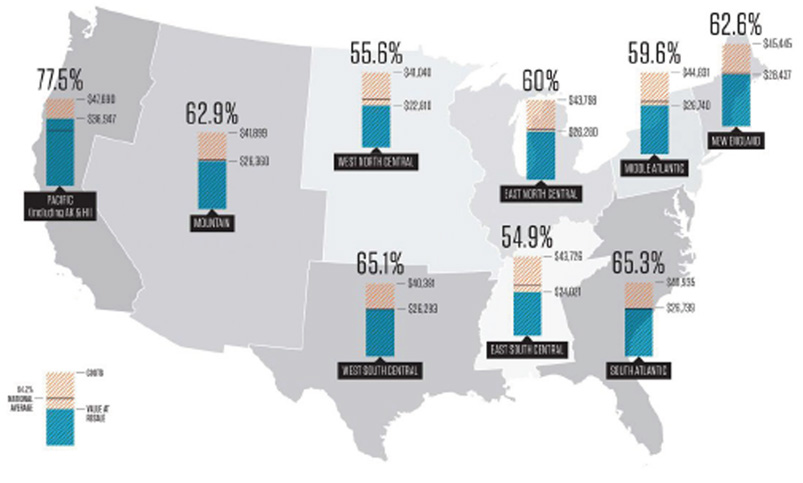
WEST COAST HAS THE HIGHEST COST-VALUE RATIOS
Continuing a longstanding trend, the Pacific census region (California, Oregon, Washington, Alaska, and Hawaii) delivered by far the highest cost-value ratios. The East South Central region again trailed the rest, with increased values at resale covering less than 55% of the average project’s cost.
All told, in 18 markets the local real estate pros said the average project would return at least 75 cents for every dollar invested. Half of those 18 are in California and Florida. In contrast, vast swaths of the Midwest and South average far worse. Out of 90 potential projects, none of the three Ohio markets of Columbus, Cleveland, and Cincinnati have a single one that scores above 89%. Nothing in Des Moines, Iowa, pays back more than 71%. (To view numbers for all the projects in all markets, go to costvsvalue.com.)
ROI OF REPLACEMENT VS. REMODELING
NARROWING THE GAP
The difference in return on investment for replacement vs. remodeling projects typically narrows as the housing market improves and widens when new-home sales begin to sour. 2016’s gap of 4.2 percentage points is one of the smallest that we’ve seen in years.
Differences between markets also show up when you break down the results by the nation’s nine different census regions. Once again, the Pacific region (encompassing California, Oregon, and Washington plus Alaska and Hawaii) had by far the highest cost-value ratio at 77.5%. That’s way above the second-place finisher, the South Atlantic states, which came in at 65.3%. The lowest region was the East South Central states of Alabama, Kentucky, Mississippi, and Tennessee. Their projects had an average cost-value ratio of just 54.9%. Seventy-seven markets had at least one project with at least a 100% return on investment. Typically, it was the fiberglass attic insulation job, where the payback exceeded the investment in 60 markets. The manufactured stone veneer job came in second, with cost-value ratios hitting triple digits in 31 markets. The two garage door projects followed at 30 and 27 markets,
respectively (click below to view the chart). Daytona Beach, Fla., had the largest number of rewarding jobs with 18 projects at or over 100%, while the Silicon Valley twins of San Francisco and San Jose, Calif., tied for second at 16 projects each.
BANG-FOR-THE-BUCK LEADERS
RECEIVE HIGH RETURNS AT RESALE ON THESE TOP PROJECTS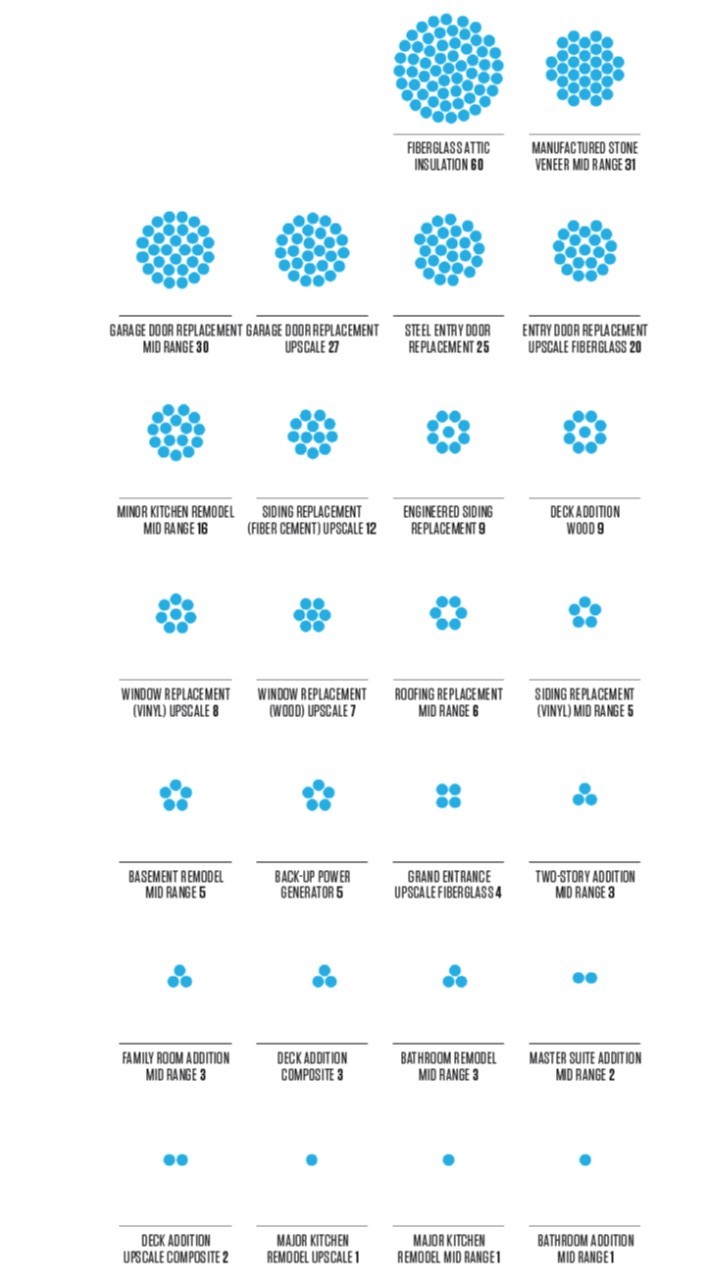
Nationwide, 77 of the 100 markets had at least one project in which the cost-value ratio was at or above 100%. Most times that project was the fiberglass attic insulation job, where the payback in an increased home price at resale exceeded the investment in 60 markets. Only four of the 30 projects failed to generate a 100% payback somewhere in the country.
THE VALUE OF STANDARDIZATION
It’s not just its decades of history that makes Cost vs. Value stand out among the increasing number of services claiming to provide useful estimates. It’s unique in that both costs and values are based upon theoretical rather than actual projects. That makes apples-to-apples comparisons possible from coast to coast.
And we’re pretty detailed in how we describe those apples. For instance, here’s what we require to be done for the upscale kitchen renovation project:
“Update outmoded 200-square-foot kitchen with 30 linear feet of top-of-the-line custom cherry cabinets with built-in sliding shelves and other interior accessories. Include stone countertops with imported ceramic-or glasstile backsplash; built-in refrigerator, cooktop, and 36-inch commercial grade range and vent hood; built-in warming drawer, trash compactor, and built-in combination microwave and convection oven. Install high-end under-mount sink with designer faucets and built-in water filtration system. Add new general and task lighting including low-voltage under-cabinet lights. Install cork flooring, cherry trim.”
Such details make it possible to create consistent cost estimates for all markets, estimates in which the variations by market depend solely on differences in material and labor costs and not because of differences in room size or structural details.
To that description we add a sketch of each project in the survey that we send to real estate professionals, sometimes including before-and-after versions. This particularly helps the Realtors visualize what’s involved in the project and thus how much it’s worth at resale.
ABOUT THOSE COSTS
Nearly six percentage points separate the highest and lowest cost increases for the 28 projects included in both the 2015 and 2016 reports. The steel entry door project went up the most, rising 8.6%; that plus its 4.3% fall in value combined to knock it off the top spot for cost-value payback. The midrange bathroom remodel ranked second among cost increases, rising 7.1%. Then came the upscale fiberglass entry door project (rising 6.8%), the upscale garage door replacement (6.7% higher), and the midrange bathroom addition (also up 6.7%).
On the other end of the scale, the midrange vinyl siding replacement job was rated only 2.7% more expensive in this year’s report. Next was the midrange family room, up only 2.9%; the roofing replacement job, up 3.1%; the foam-backed vinyl siding replacement, up 3.5%; and the midrange garage door replacement, up 3.6%. Costs vary by market, but not consistently.
For a midrange basement remodel, the lowest-cost market in the nation is McAllen, Texas, at $57,844, while the costliest area is San Francisco at $94,081—a difference of 63%. But for an attic insulation job, your lowest price is in Augusta, Ga., at $1,198, while the most expensive is New York at $1,426. And between those two cities the gap is just 19%. A spot check of the cost differences by market found a 24% gap for the steel entry door job, a 32% difference for the master suite, and a 61% variation for roofing.
HIGH VALUE MARKETS
TOP 18 MARKETS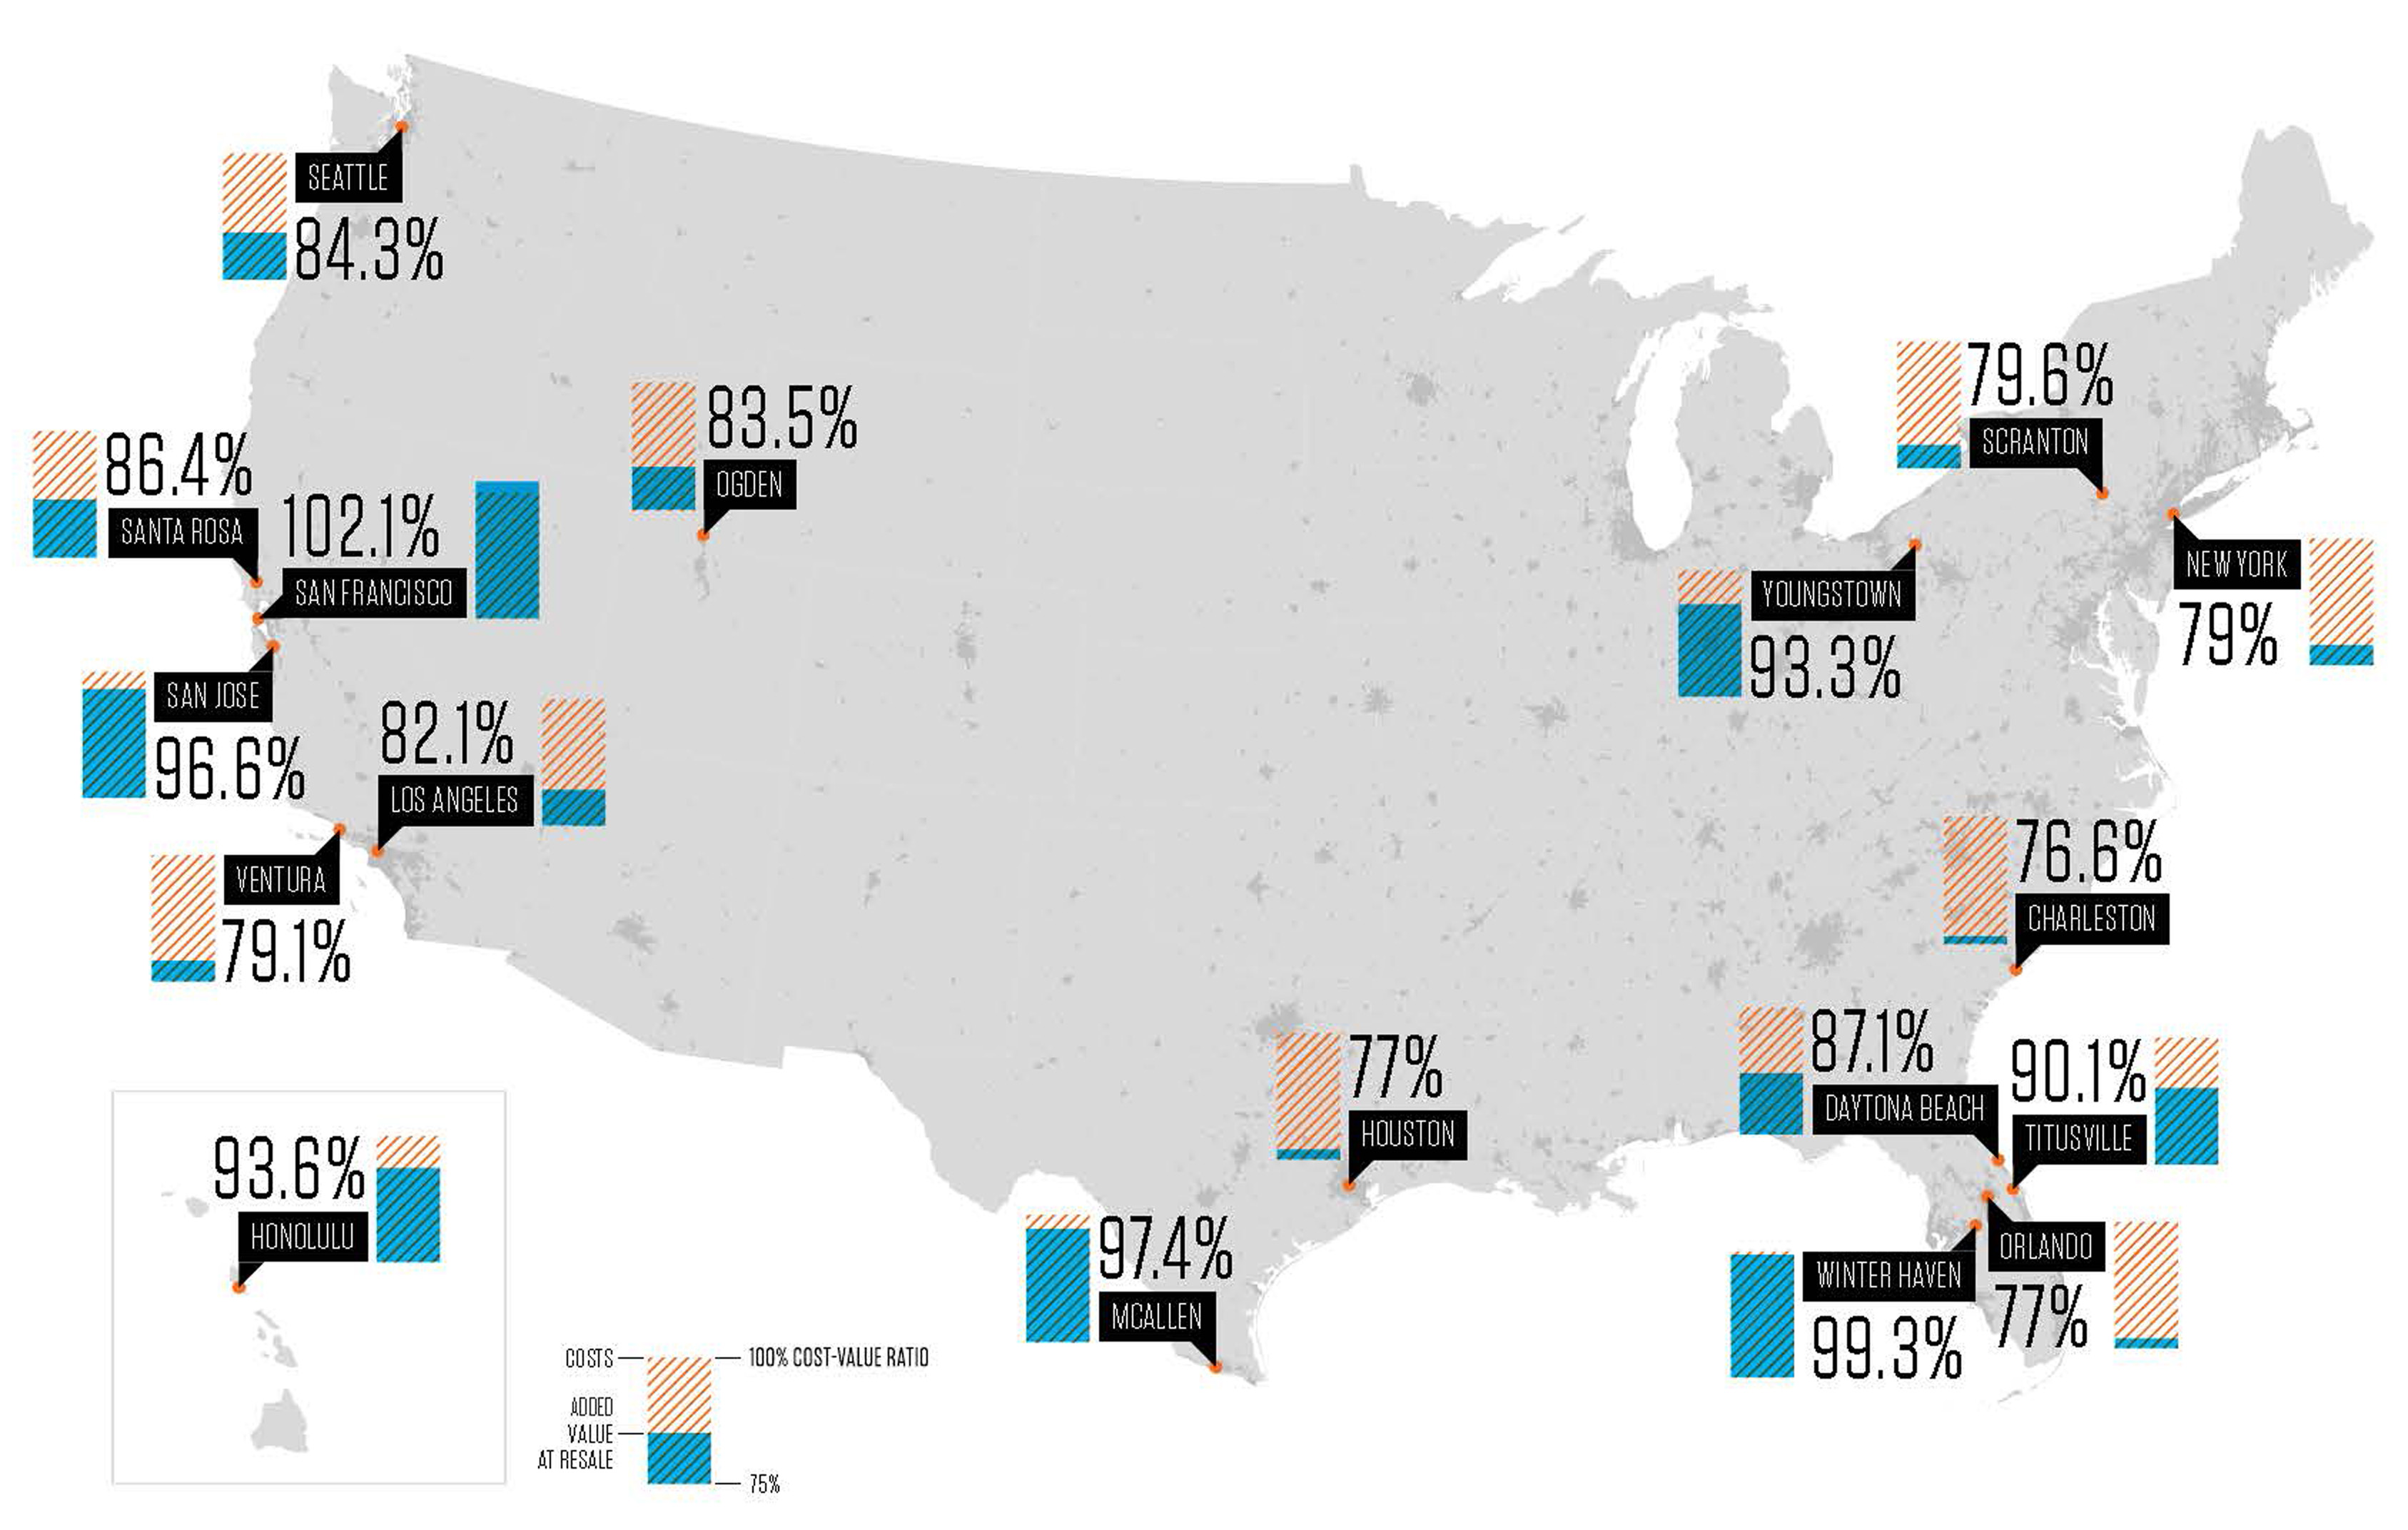
In 18 of the 100 markets tracked by Cost vs. Value, the average return on investment topped 75%. But the reason why varied. In poorer markets like McAllen, Texas, it was because costs were among the lowest nationally. In the Bay Area and New York, the high price of housing pushed up values.
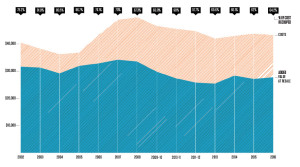
HOW TIMES HAVE CHANGED
Cost vs. Value also provides good historical perspective if you stick to the 17 projects that have been part of the study since 2005. In that year, the average job cost $41,204 and real estate professionals estimated the value of those 17 jobs at $35,871, for a cost-value ratio of 87.1%. Then things started changing drastically. In 2006, the cost of jobs climbed 28%, to $52,729, and then they rose another 14.7% in the 2007 report to hit $60,496. That average has stayed above $60,000 since then, reaching $68,233 for the 17 projects in this year’s report. All told, the gain in costs totals 66% since 2005 and 29% since 2006.
Meanwhile, the increased value at resale that real estate pros gave for that work hasn’t risen nearly as fast. Yes, in 2006 the average value jumped 12.3% to $40,279 and then gained another 6.6% to hit $42,927 for the 2007 report. But that was Realtors’ high-water mark. Since then, the value that real estate pros have put on the 17 perennial remodeling jobs has slumped in six of the past seven reports. Only in this year’s report are we seeing a turnaround, with value estimates for the 17 projects rising 7.3% and the overall value-add finally topping 2007’s number to reach $43,459. Again, it’s likely that you can credit the housing market’s recovery with the change in remodeling’s climate. And the outlook for 2016? Bigger and better.
FUTURE PROSPECTS
“On the new-homes side, we’re forecasting for 2016 a 15.5% growth in single-family starts, and the number for overall starts [growth] is closer to 12%,” said Toby Morrison, Metrostudy’s national sales manager for building products manufacturing and distribution. “On the repair and remodel side, we’re looking at a growth rate of 3.8%. It’s not a hockey-stick recovery, but we think that trend is going to continue.”
Your local conditions may vary, of course. “Low oil prices have had some impact in places that had been stronger, such as the Gulf Coast areas like Houston,” Diehart said. “Denver and Greeley, Colo., are doing really well; they have strong economic fundamentals. And Austin (Texas) is still growing well.” Metrostudy’s economic scenarios forecast continued growth at least until 2018. More pessimistic types fret about the impact of interest-rate increases.
Morrison disagrees. “I see an interest increase as not being a terrible thing,” he says. “Two years ago, when there was talk of raising rates, we did some analysis that found so long as rate increases weren’t crazy, it actually caused a pretty significant spike in starts and sales because it pushes people off the fence. “Also, the banks are so darn conservative these days because they’re not making money on loans,” Morrison added. “When rates go up, they may be more willing to open their coffers.”
RESEARCH TEAM
• RemodeiMAX (remodelrnax.com), a publisher of estimating tools for remodelers, used Clear Estimates (clearestimates.com) remodeling software to generate cost estimates for all 30 projects in 100 metro markets.
• The Farnsworth Group (thefarnsworthgroup.com), a market research company, programmed and hosted the Remodeling Cost vs. Value Web-based survey. It also collected and compiled the data.
• Hanley Wood surveyed real estate professionals nationwide between August and October.
• Metrostudy (metrostudy.com), like Remodeling a unit of Hanley Wood, provided consulting help on the survey and its results. 62.6% 58.6% 60%
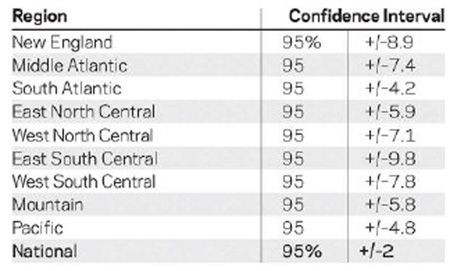
CONFIDENCE INTERVALS: For national averages, the confidence interval is 95% +/-2. (This means that 95% of the time, national results for this survey will fall within 2 points to either side of the results published here.) Confidence intervals for each of the nine regions are shown below.